5 moves on the farm P&L. The ceasefire headline vs the physical supply chain. 9-indicator dashboard. The full nitrogen cost framework. The scenario table. The CFO Move.
This analysis was completed April 4 and published the evening of April 7. Hours after publication, the US and Iran announced a two-week ceasefire with Iran agreeing to allow "safe passage" through the Strait of Hormuz under coordination with Iranian armed forces. Oil futures crashed 16-19%. The physical supply chain has not moved. The scenario framework, breakevens, and CFO Move below were built for exactly this moment. Start with the "What to Watch" section in the CFO Brief.
Prairienomics Signal Pack - Week of April 7
🟡 Oil futures crashed 16% on ceasefire. The physical supply chain has not moved.
WTI fell from US$117 to below US$94 in hours on Tuesday evening after the US and Iran announced a two-week ceasefire brokered by Pakistan. Iran agreed to allow "safe passage" through the Strait of Hormuz under military coordination. Brent dropped to roughly US$96. The futures market repriced the headline instantly. The physical market has not. Dated Brent (the benchmark for actual barrels of crude) hit a record US$144.42 (S&P Global) before the announcement. Ship transits through Hormuz dropped from 130 per day in February to 6 in March (UN panel). Eurasia Group estimates shipping companies need two or more months to resume operations even if the war stops permanently, and infrastructure damage takes months to repair. No physical urea, sulfur, or ammonia has moved through the Strait. Iran's own statement: "This does not signify the termination of the war." Canadian diesel will lag crude by days to weeks. The crude futures price repriced the headline. The nitrogen supply chain, the diesel supply chain, and the fertilizer logistics chain have not repriced the physical reality. For the full scenario framework and the three indicators to watch, see this week's CFO Brief below.
🟡 US wheat acreage lowest since 1919.
USDA's Prospective Plantings report on March 31 pegged total US wheat at 43.8 million acres. Spring wheat intentions dropped 6%. Durum fell 11%. At the same time, 57% of US winter wheat acres are in drought, and crop condition ratings are well below average. High nitrogen costs are the common thread: soybeans fix their own nitrogen, and the canola-to-wheat gross margin gap is running at roughly C$389/ac. The acreage shift tightens the supply outlook for quality milling wheat and protein crops into 2027. For US Northern Plains operators, PLC is almost certainly triggering on wheat. The projected marketing year average of US$5.30 is more than a dollar below the new OBBBA reference price of roughly US$6.35, projecting to about US$89/base acre in payments arriving October 2026.
🔴 The rate environment flipped in one month.
The GoC 5-year bond yield reached 3.09% on April 2, up 30 basis points in a single month, the fastest move in over a year. FCC uses GoC 5-year plus 250bp as a starting point for fixed farm lending rates, which puts the implied 5-year fixed at approximately 5.59%. Four weeks ago it was closer to 5.29%. On a C$2M term loan, the difference is roughly C$6,000/yr, or C$1.20/ac on 5,000 acres. In the US, the implied probability of a Fed rate hike before year-end passed 52% for the first time. March CPI data releases April 20. The BoC decides April 29. If energy-driven inflation surprises to the upside, the next move in rates may not be the cut everyone was planning for.
🔴 Rail car supply at 65% for nine straight weeks.
CN and CPKC are delivering 65% of ordered hopper cars. CPKC alone is at 52%. That is nine consecutive weeks below 90%, approaching levels not seen since the 2013-14 rail crisis. At those fulfillment rates, elevators on CPKC lines cannot bid full value for farmer grain. The basis penalty runs C$10-25/t at affected delivery points. On 2,000 tonnes of canola, that is C$20,000-50,000 in revenue that should be yours but is leaking out through a logistics bottleneck. This is not a demand problem. Futures prices are firm. It is a supply chain problem that takes real money off the farm P&L even in a decent revenue environment.
🟢 APP confirmed at C$500K interest-free. AgriStability closes April 30.
On April 1, Minister MacDonald confirmed the Advance Payments Program interest-free limit at C$250,000 for all commodities, plus an additional C$250,000 on canola only. CCGA issued C$335 million to 1,740 Western Canadian farmers on day one, with applications running ahead of previous years. The number that does not get enough attention: the value of interest-free money scales directly with the rate environment. When BoC was near zero in 2021, C$500K interest-free saved maybe C$3,000/yr. At current rates (2.25% overnight plus a 4.5-5.5% commercial credit spread), the same limit saves roughly C$22,000-C$27,500/yr. The program did not change. The rates around it tripled its value. AgriStability 2026 enrollment closes April 30. With input costs up C$40-60/ac from baseline, the probability of breaching the 30% margin trigger is the highest in years.
Sources: Argus Media, Profercy World Nitrogen Index (Mar 19), DTN Fertilizer Index (Mar 18-25), CME/CBOT (Apr 2-3, Apr 7 evening), ICE Futures Canada (Apr 3), TradingEconomics/Bank of Canada (Apr 1-2), USDA Prospective Plantings (Mar 31), USDA AMS Iowa Production Cost Report (Mar 20), EIA Short-Term Energy Outlook, Ag Transport Coalition (Week 33), AAFC APP announcement (Apr 1), CCGA (Apr 2), AFBF, CSIS, NDSU Ag Trade Monitor, Eurasia Group (Apr 7), S&P Global Commodity Insights, Axios, NBC News, Al Jazeera.
Indicator Dashboard
IndicatorValueDir
Canola (ICE May)C$727/t↑
NOLA UreaUS$690+/st↑↑
Anhydrous (US)US$924/ton↑↑
GoC 5-yr Bond3.09%↑
WTI Crude~US$94/bbl↓↓
Rail Cars (Wk33)65%↓
CAD/USDUS$0.717↓
Soy CrushUS$3.51/bu↑↑
BoC Rate2.25%→
Revenue side: Canola and crush margins holding firm. Cost side: Nitrogen and fertilizer at multi-year extremes. Oil futures crashed on ceasefire but physical supply chain has not moved. Financing side: Bond yields rising fast. Logistics: Rail car supply eroding basis.
Jul 1 — USMCA/CUSMA review deadline. 40 US ag groups formed coalition opposing withdrawal.
CFO Brief #1: The C$50/ac Gap
What Pre-Buying Nitrogen Is Worth Right Now
The Signal
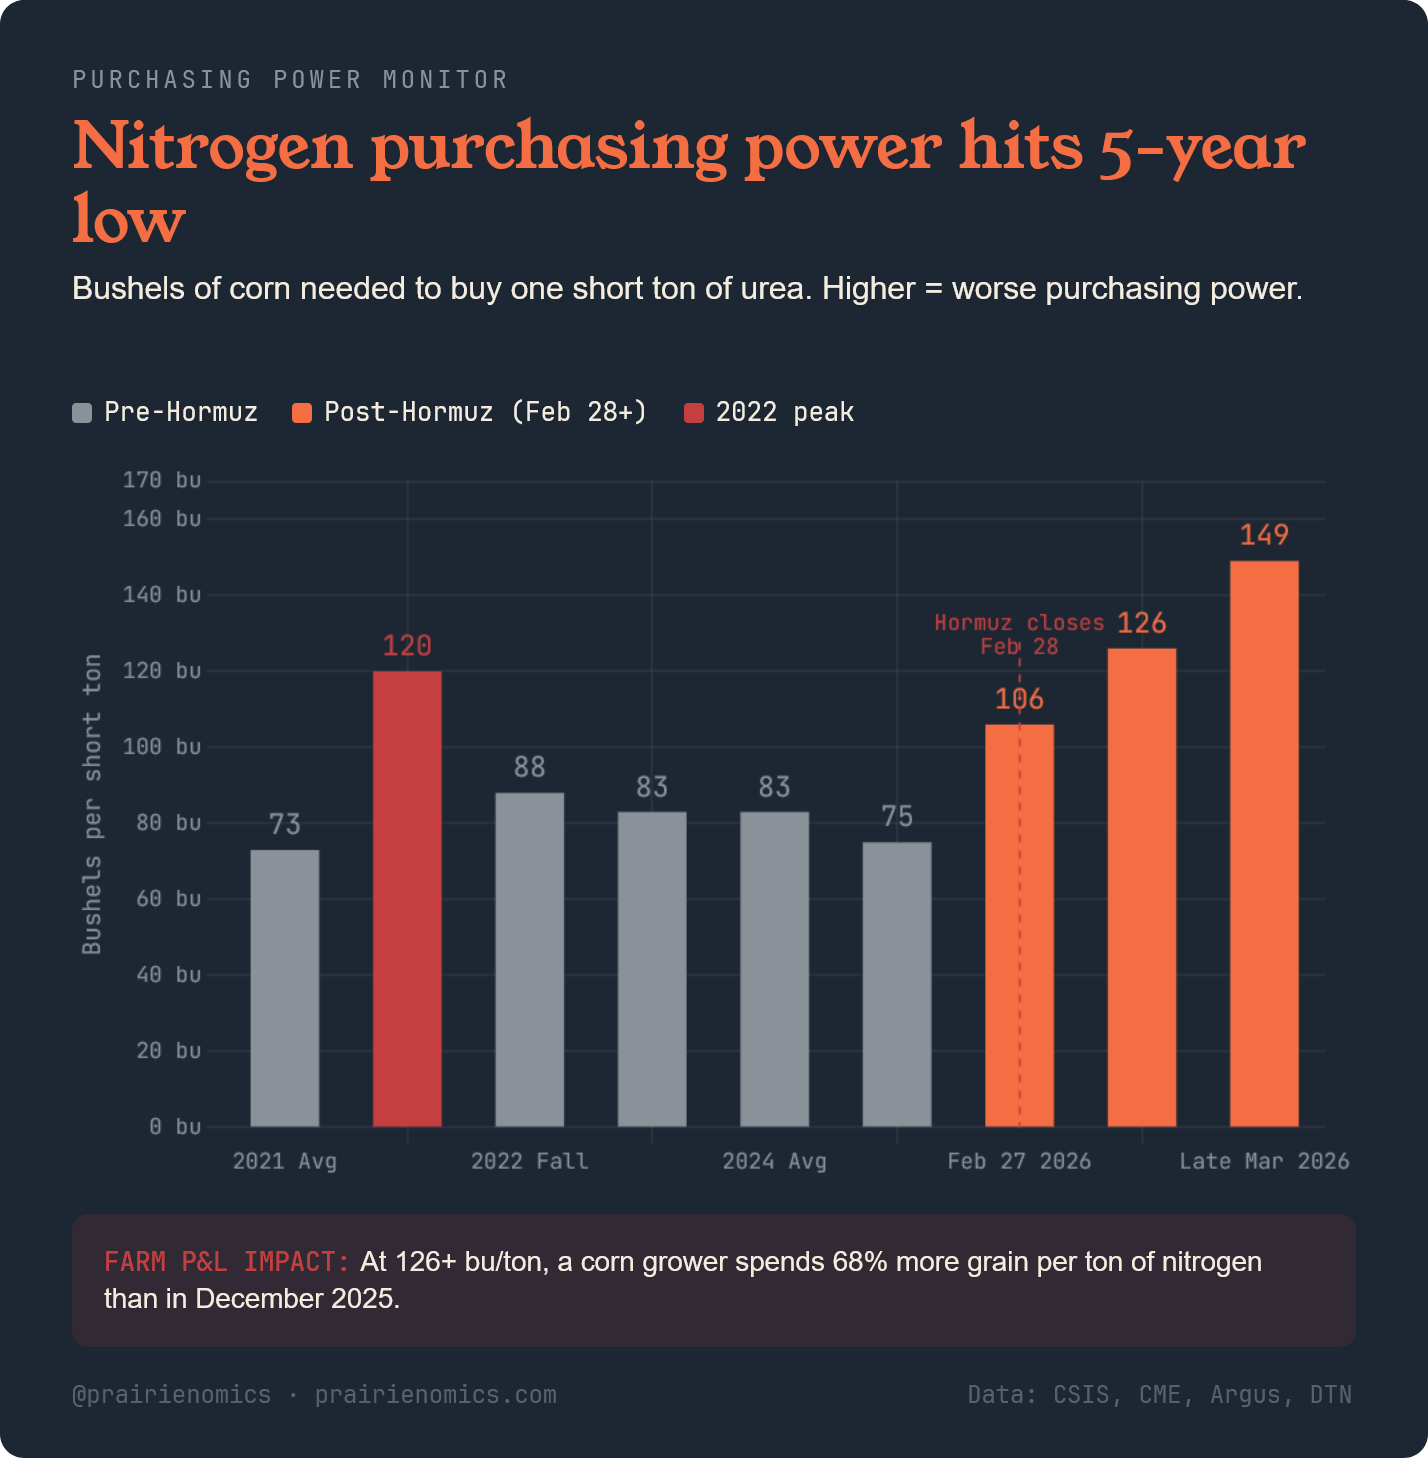
The question is not whether nitrogen is expensive. Everyone in the grain belt knows nitrogen is expensive. The question is what it costs you, in dollars per acre, to have not locked it in before the Strait of Hormuz closed on February 28.
Four numbers frame the answer. NOLA urea barges traded past US$690/st in the third week of March, up from roughly US$475 the day before US and Israeli strikes on Iran began (Argus Media, Profercy). DTN's national retail survey showed anhydrous ammonia at US$924/ton, above US$900 for the first time since May 2023. The Profercy World Nitrogen Index reached 313.85, its highest since October 2022. And the ratio that compresses all of this into one number: in December 2025, one short ton of urea cost the equivalent of 75 bushels of corn. By mid-March, it cost 126 bushels (CSIS). That is the worst nitrogen purchasing power in five years.
The Mechanism
The causal chain: Strait of Hormuz closed → 35-50% of global seaborne urea and sulfur exports blocked → Gulf producers halt production and declare force majeure → NOLA reprices to reflect a structural supply deficit → Prairie and Northern Plains retail follows with a 4-6 week lag plus FX conversion.
The volume of fertilizer that transits the Strait is larger than most people realize. Estimates range from 35% (CSIS) to 43% (NDSU) to nearly 50% (The Fertilizer Institute) of global seaborne urea exports. At least 21 ships carrying nearly a million metric tons of fertilizer were physically stranded in the Gulf as of mid-March (CNBC). QatarEnergy shut down urea production at Ras Laffan, the world's largest single-site urea facility. SABIC Agri-Nutrients declared force majeure on shipments to South America and Asia (Carnegie Endowment). Supply alternatives are closed: China is not exporting urea until August at the earliest, CF Industries has its Yazoo City plant offline until Q4 after a November explosion, and European nitrogen production is running at roughly 75% of capacity (CF Industries). There is no relief valve.
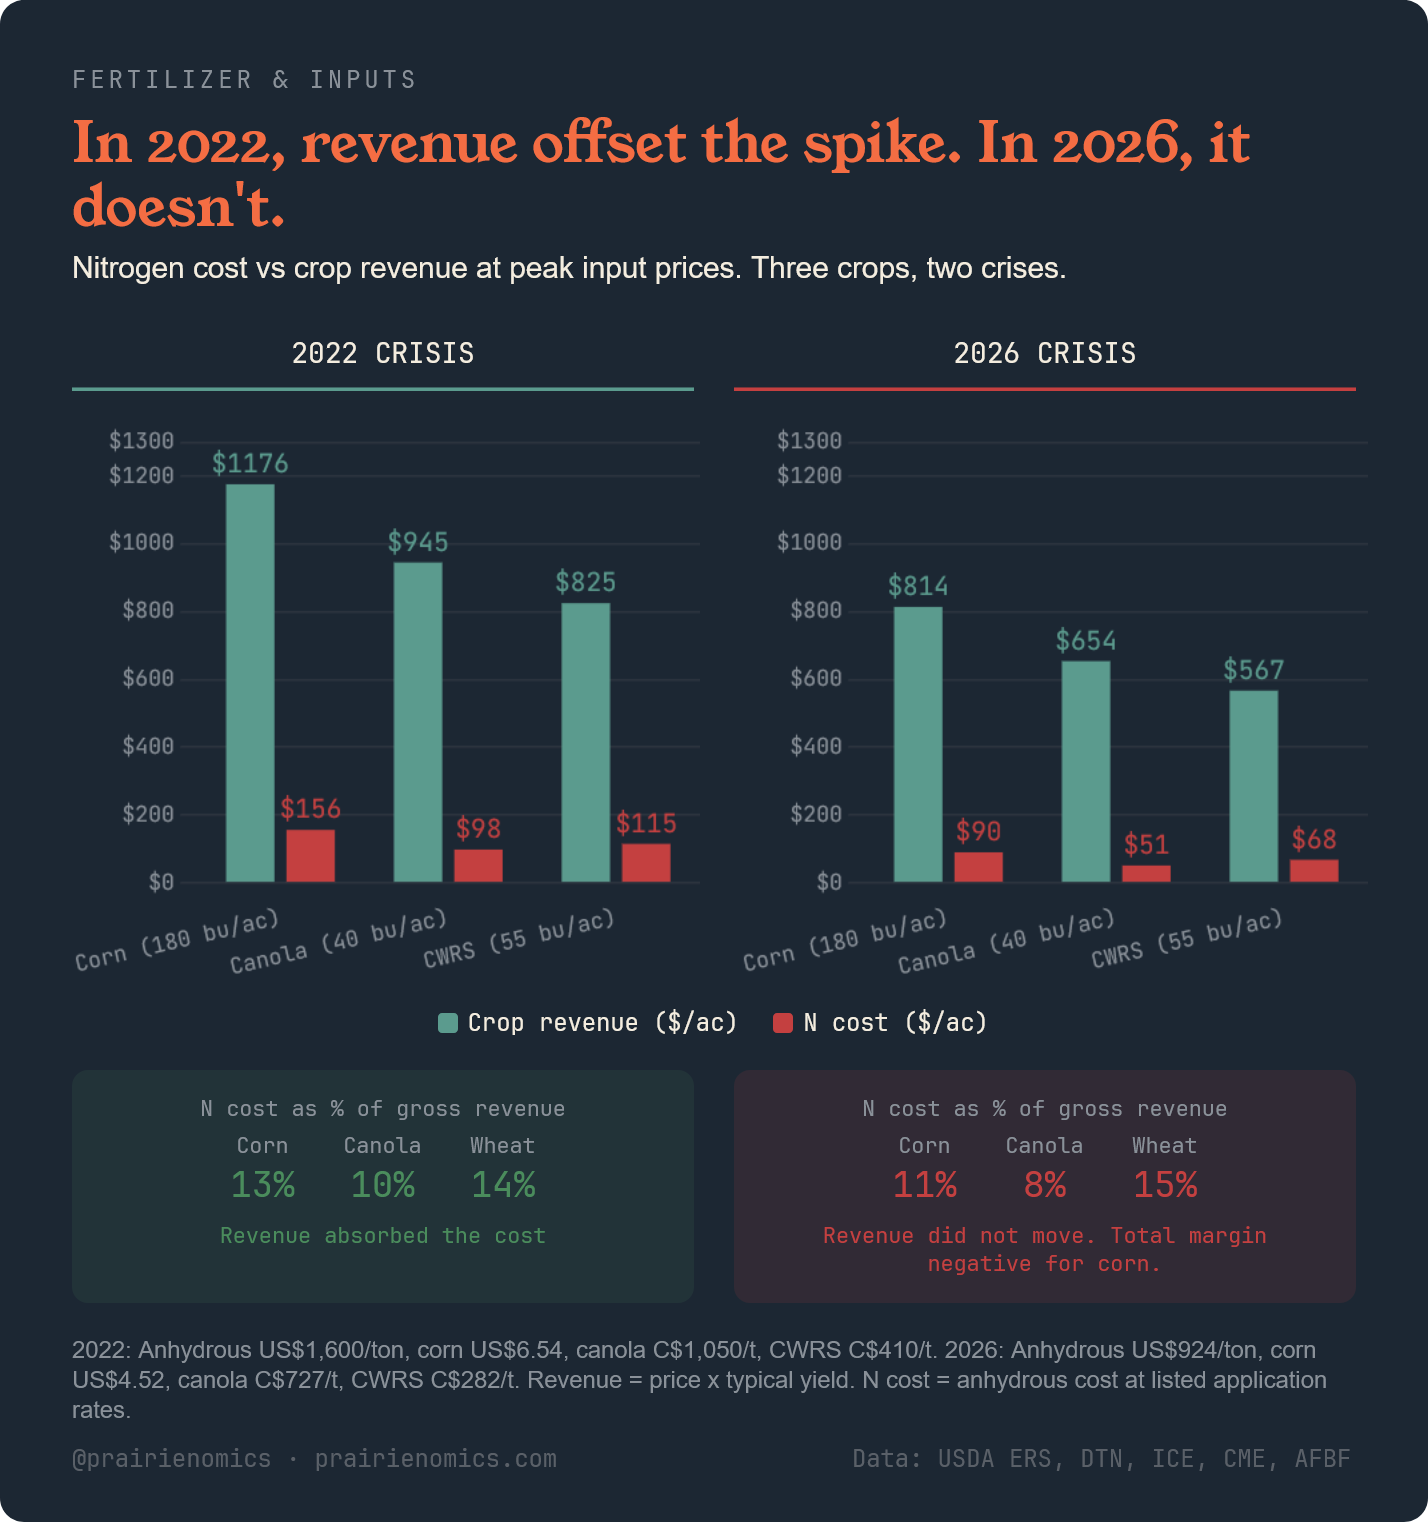
What makes 2026 different from 2022 is not the size of the nitrogen spike. It is the absence of a revenue offset.
In 2022, anhydrous ammonia peaked above US$1,600/ton and urea surpassed US$1,000/ton (USDA ERS). Those prices were higher than today's in absolute terms. But crop revenue was there to absorb it. Corn was at US$6.54/bu. ICE canola traded above C$1,050/t. CWRS wheat was above C$410/t. The revenue side covered a large share of the cost increase.
In 2026, the cost side is spiking while the revenue side has barely moved. Corn is at US$4.52/bu, 31% below its 2022 peak. ICE canola is at C$727/t, solid but 27% below the 2022 high. CWRS wheat sits at roughly C$282/t, 31% below where it was when input costs last spiked. The American Farm Bureau calculates that planting an acre of corn in 2026 costs US$917, just 1% below the 2022 record, but the projected marketing year average corn price is 37% lower (AFBF). US corn producers are now in their fourth consecutive year of operating losses.
The asymmetry holds across all three reference crops. In 2022, nitrogen cost as a percentage of gross revenue stayed manageable because both sides of the equation were elevated. In 2026, only the cost side moved.
The mechanism also has a phosphate tail that very few people are watching. The Gulf produces approximately 44% of the world's seaborne sulfur (NDSU, TFI). Sulfur is not a niche commodity. It is the feedstock for the sulfuric acid required to convert phosphate rock into DAP and MAP. When the Strait closed, it blocked not only finished fertilizers but the sulfur that phosphate producers in Morocco, China, and Indonesia depend on. China imports roughly four million metric tons of sulfur annually from the Gulf. Morocco's OCP Group, the world's largest phosphate exporter, depends on approximately 3.7 million metric tons (NDSU). Saudi Arabia built a pipeline enabling oil exports to bypass Hormuz. No equivalent infrastructure exists for ammonia or sulfur (Carnegie Endowment). The nitrogen crisis has a phosphate shadow, and it will show up in DAP and MAP pricing within weeks if the Strait stays closed.
And the money you borrow to buy nitrogen at spot is more expensive too. The GoC 5-year bond yield hit 3.09% in early April, up 30 basis points in a single month. FCC fixed rates track GoC 5-year plus roughly 250 basis points. A grower who finances a C$200,000 spot nitrogen purchase today is borrowing at approximately 5.6%, compared to roughly 5.3% four weeks ago. The cost of the product spiked AND the cost of financing it rose simultaneously.
The dollar-per-acre math on a reference Prairie operation:
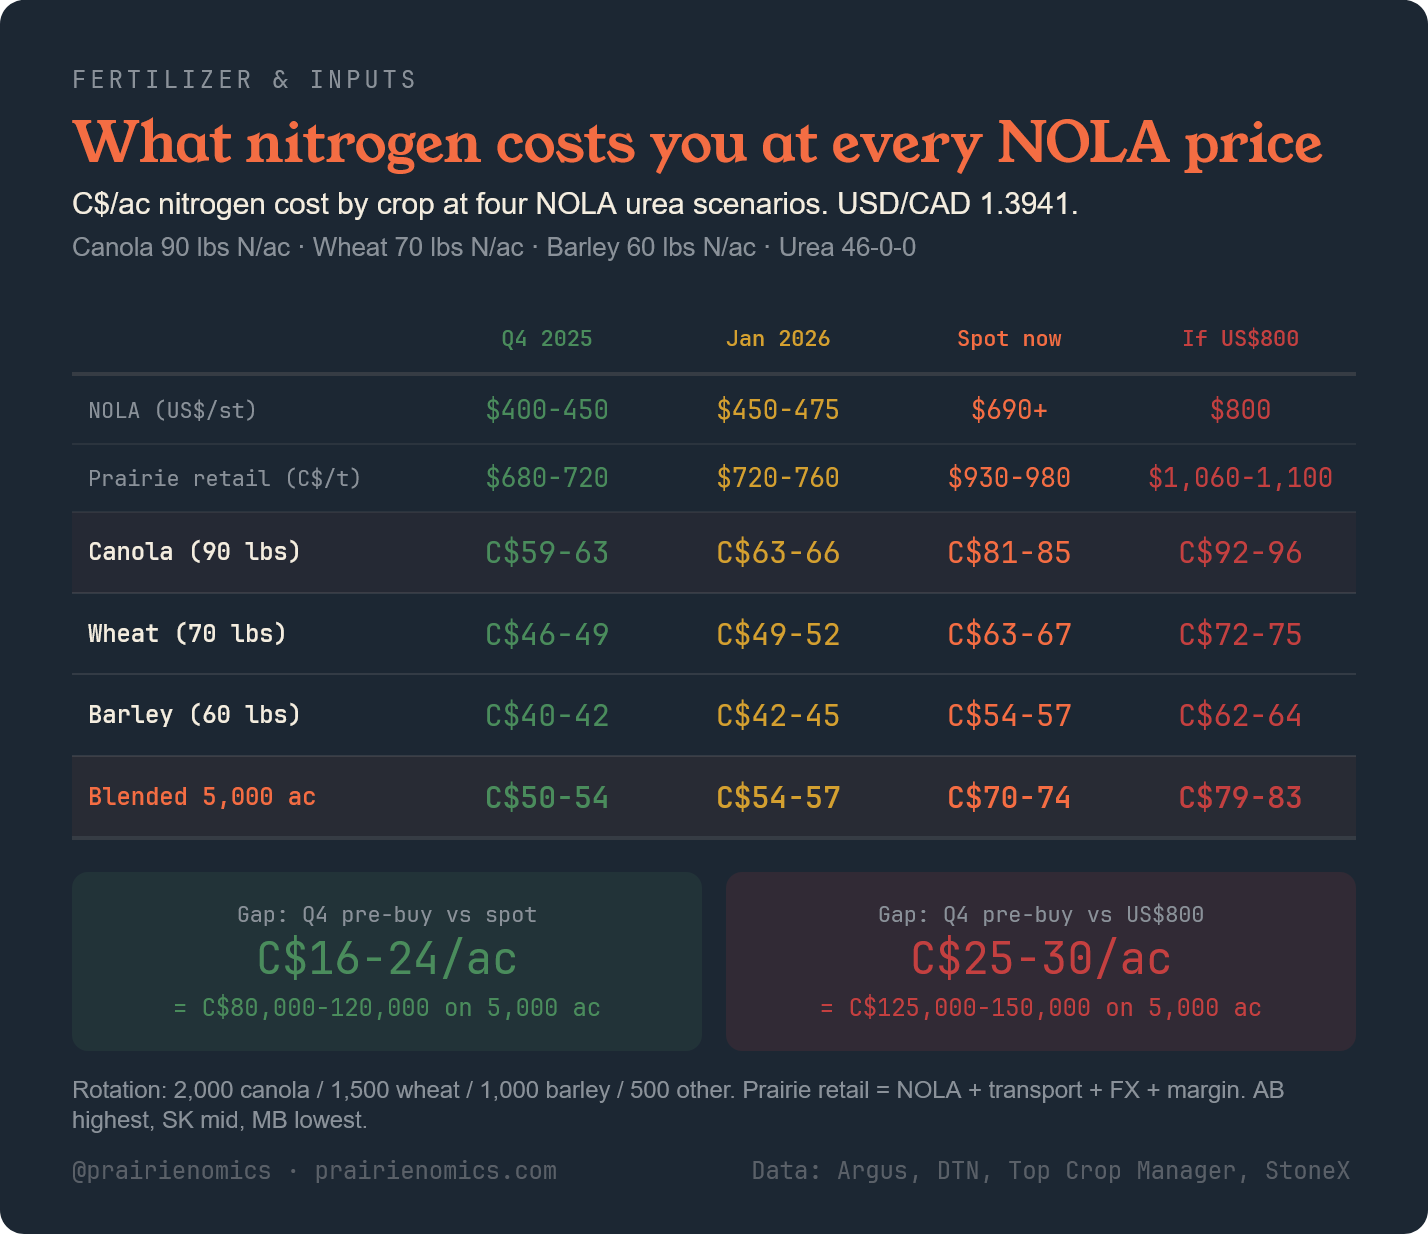
Assumptions: 5,000 total acres. 2,000 canola (90 lbs N/ac), 1,500 CWRS wheat (70 lbs N/ac), 1,000 barley (60 lbs N/ac), 500 other. All nitrogen applied as urea (46-0-0). USD/CAD 1.3941. Prairie retail urea pricing builds from NOLA plus shrink, broker profit, rail freight, FX conversion, handling, and retail margin. Western Canadian retail historically trades roughly C$50-80/t above NOLA import economics, with nitrogen typically most expensive in Alberta, cheaper in Saskatchewan, and lowest in Manitoba (Top Crop Manager).
The gap between a Q4 2025 pre-buy and today's spot market is C$16-24/ac blended across a canola/wheat/barley rotation. On 5,000 acres, that is C$80,000-C$120,000. If NOLA reaches US$800 before the Strait reopens, the gap widens to C$25-30/ac, or C$125,000-C$150,000.
The FX conversion compounds the problem for Canadian buyers. Urea is priced in US dollars. The CAD has weakened to US$0.717, down 2% in March alone. A 2-cent CAD decline on a US$690 NOLA urea barge adds roughly C$15-20/t at retail. The commodity price spiked AND the currency conversion makes the spike more expensive in Canadian terms.
The Framework
Three scenarios, segmented by operation type.
Scenario A: Hormuz reopens within 3 weeks. NOLA urea retreats to US$500-550/st within 4-6 weeks as stranded vessels resume transit. Prairie retail adjusts downward with a lag, reaching C$750-800/t by June. The gap between pre-buy and spot narrows to C$5-10/ac.
Probability as of April 7: Higher than last week, but not confirmed. The two-week ceasefire moves this from "low" to "possible." But "safe passage via coordination with Iranian armed forces" is not the same as an open waterway. Ship operators need war-risk insurance to fall before they move. No vessels have transited yet. Iran's statement explicitly says this does not end the war.
Scenario B: Hormuz remains disrupted through May. NOLA urea stays in the US$600-750 range. Prairie retail stays at C$900-1,050/t. The gap holds at C$15-25/ac. Some supply trickles through non-Gulf sources, preventing prices from reaching 2022 extremes. But availability, not just price, becomes the constraint. Dealers in some regions may not have physical product to sell at any price.
Scenario C: Hormuz stays closed through June. NOLA urea approaches US$800-900/st. Close to the 2022 peak in nominal terms, far worse in margin terms because crop prices are 30-40% lower. The acreage shift already underway accelerates. USDA showed US farmers intending to plant 4% fewer corn acres and 5% more soybeans. In Canada, actual canola seeding will almost certainly exceed 22 million acres as growers shift away from nitrogen-intensive cereals.
Invalidation for all scenarios: China lifts urea export restrictions before August. That would add 4-6 million metric tons to the global market and break the price ceiling above US$750.
What to watch to know which scenario you are in.
Three indicators. First, war-risk insurance premiums for Hormuz transit. Currently above 10% of cargo value. If premiums fall below 5%, commercial shipping resumes regardless of military status. That is the earliest signal of Scenario A. Second, China's urea export restrictions. Any announcement before August changes the supply math fundamentally. Third, the April 9 USDA WASDE report, which updates MYA price projections that determine PLC payment calculations and the pace of the acreage response. The first of these three to move tells you which scenario is materializing.
Revenue-side relief for US operations: PLC payments are coming
The OBBBA raised PLC reference prices significantly. Wheat's new effective reference is roughly US$6.35/bu. The projected marketing year average is US$5.30. That gap projects to approximately US$89/base acre in PLC payments, arriving October 2026. For corn, the projected MYA of US$3.90 is below the new reference of roughly US$4.01, triggering a smaller but meaningful payment. ARC-CO may outperform PLC for corn in counties where yields were below average, given the new 90% guarantee level and 12% payment cap under OBBBA.
On a 1,000-base-acre wheat operation, US$89,000 in PLC payments covers a substantial portion of the added input cost. The net margin squeeze is real, but it is not as deep as the input cost numbers alone suggest.
Financing the gap: the program stack that absorbs the shock
For Canadian operations, two programs stack right now. The Advance Payments Program provides up to C$500,000 interest-free on canola (C$250K base plus C$250K canola-specific). CCGA issued C$335 million on day one. At current borrowing rates, the interest-free value is roughly C$22,000-C$27,500/yr. That number has nearly tripled since 2021 without the program changing. When BoC was at 0.25%, interest-free on C$500K saved perhaps C$3,000 per year. At current rates, the same program saves C$22,000-C$27,500. The rate environment made the program dramatically more valuable without Ottawa changing a single parameter.
AgriStability 2026 enrollment closes April 30. With input costs spiking C$40-60/ac above historical reference margins, the probability of breaching the 30% margin decline trigger is higher than it has been in years. The enrollment fee of C$1,000-3,000 is a fraction of the potential payout, which is uncapped. If you are not enrolled by April 30, you cannot file a claim for 2026.
CFO Move
If your nitrogen is not purchased for 2026, the math favors buying now for 75% of intended application and holding 25% in reserve. The breakeven on this decision is roughly US$550/st NOLA. Below that level, you overpaid on the first 75%. Above it, you secured supply below the peak and retained flexibility to buy the final 25% cheaper, or reduce application rates if prices keep climbing.
If your cash position cannot absorb spot nitrogen at today's prices, the alternative is to shift 10-15% of intended cereal acres toward canola or soybeans, which require no purchased nitrogen. At current margins, canola's gross revenue advantage over wheat is roughly C$389/ac. Replacing 500 wheat acres with canola on a 5,000-acre operation generates approximately C$194,500 in additional gross revenue, more than covering the nitrogen cost increase on the remaining acres.
If you pre-bought in Q4 2025 or January 2026, you hold a real and quantifiable cost advantage of C$16-24/ac over your neighbors who are buying at spot. Do not give that advantage away by panic-selling into a weak nearby basis caused by rail car shortages. CN and CPKC are delivering just 65% of hopper car orders, with CPKC at 52%, for nine consecutive weeks. The basis penalty is a logistics problem, not a demand problem. Price your grain into deferred delivery months where basis is stronger, or hold physical inventory if your storage costs are below the carry the market is offering.